We’ve just released version 1.3.4 of Property Hive which sees us introduce our fab new Reports module. In this post we’ll take a look at the first four property reports available with this new release.
Reports can be invaluable to estate agents. As Property Hive and WordPress becomes more of a critical tool for agents, especially with them now being able to track viewing, offers and sales, we wanted to make sure that we begin the reports module and make it available in WordPress for agents to get an overview of how they’re performing.
The introduction of reports sees us add four property reports by default. Let’s take a look at each of these below:
Sales and Lettings Property Stock Analysis
These reports allow you to see at a glance an overview of the properties you currently have on the market. The Property Stock Analysis reports are available to show data in two ways:
Averages
In this report you can select two metrics. Metric one will be shown on the Y-Axis and metric two will be shown on the X-Axis. The aim of this report is to display the average price or number of bedrooms (metric two) for each metric one chosen. For example, if ‘Property Type’ is selected as the first metric and ‘Price’ is the second metric, you’ll be shown the average property price for each property type.
You can see this in action fro the screenshot below:
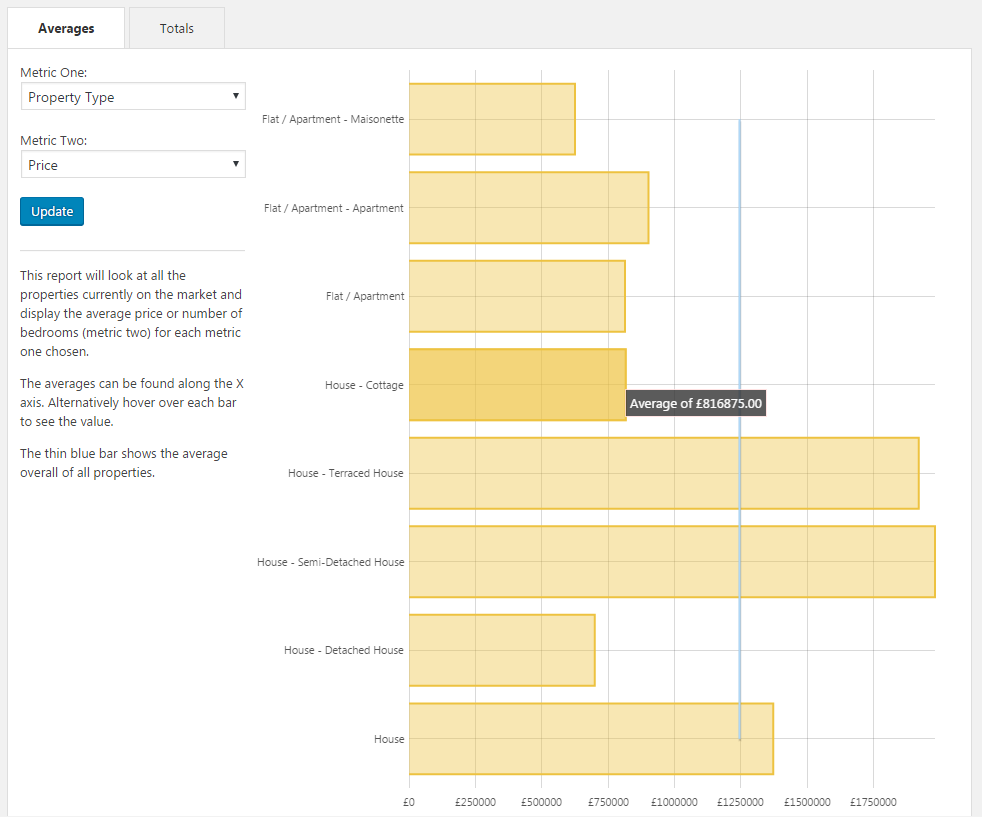
The vertical blue line will show the average of all the on market properties.
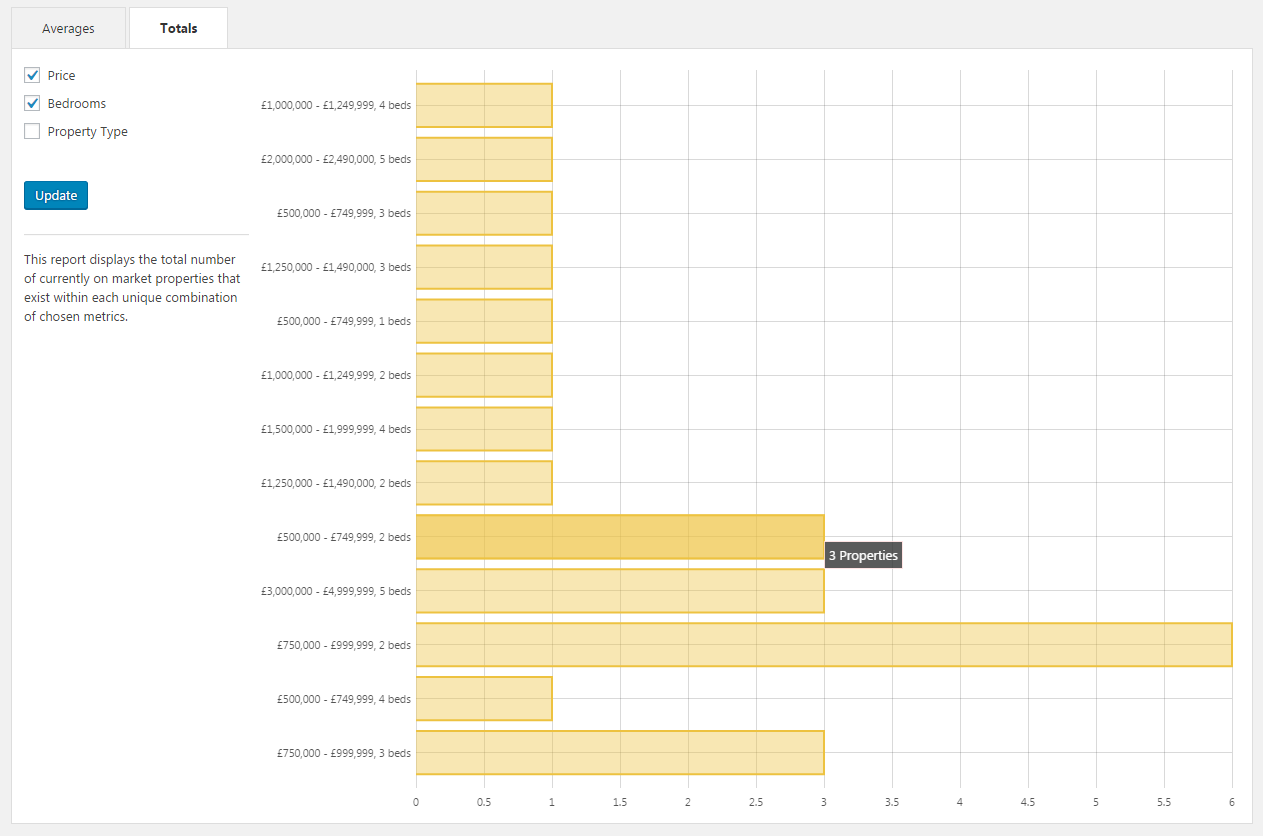
Totals
The second ‘Totals’ report will display the total number of properties for each metric chosen. If ‘Price’ is the chosen metric then you’ll be presented with a chart displaying how many properties fall into price bracket.
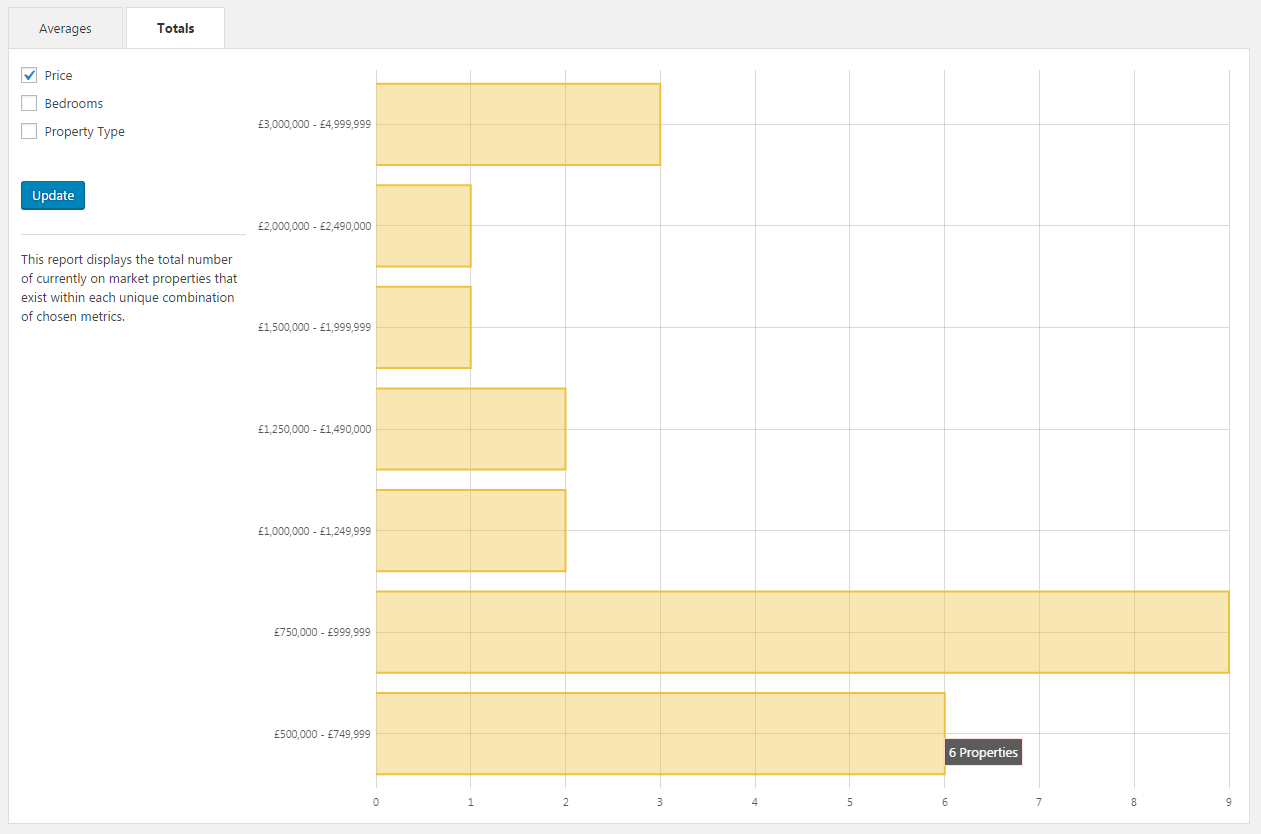
You can also choose multiple metrics. In the screenshot below you can see we’ve selected ‘Price’ and ‘Bedrooms’:
Sales and Lettings Property Popularity
We recently announced that we’d started to track property views in Property Hive. What this allows us to do is bring you this report which displays the most and least viewed properties on your website.
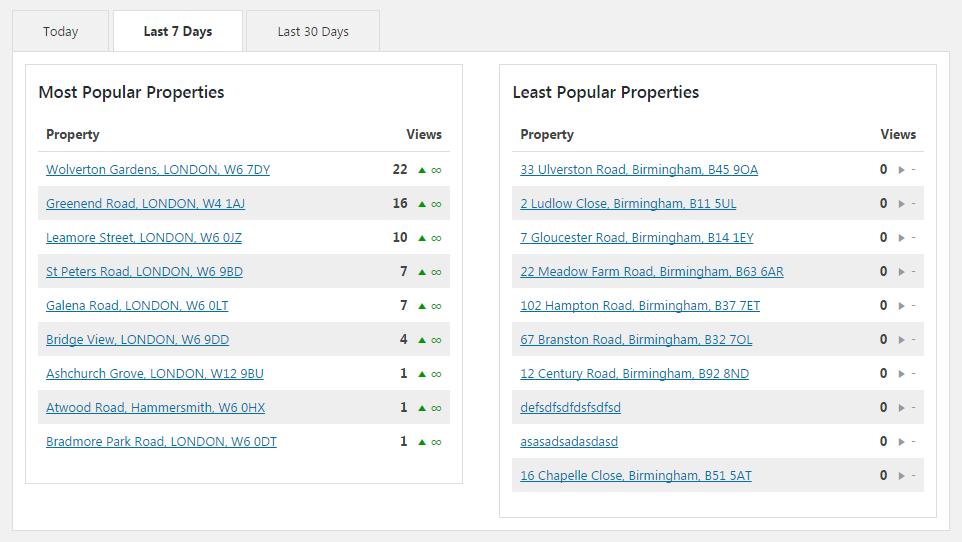
You can choose to view data from today, the last 7 days, or the last 30 days. The top 10 most and least popular properties will be displayed, as well as whether the number of views has gone up or down based on the same previous timeframe.
This is great because it allows you do many things. For example, if a property isn’t performing particularly well it might flag up that something isn’t attracting visitors. Maybe the photos need redoing, maybe the description needs to be made more enticing, or perhaps you could make it a featured property to see if that improves the number of views.
This new functionality is all part of the free core plugin so simply update to take advantage.
This is just the beginning of reports in Property Hive. We’ve got lots of ideas for new reports and will announce them as more become available. We’d love to hear thoughts on these new reports, as well as if there are any reports inparticular you’d like to see in the future.